TaskView 1.15.0 - Graph View

Nikolai Giman
TaskView founder and maintainer
Fullstack developer
Hi everyone!
In this update, I’ve added a new way to organize your tasks - Graph View. Now you can see your tasks not just as a list or Kanban board, but as a visual map.
With the graph, you can:
- see how tasks are connected;
- understand the full structure of your project;
- find dependent and related tasks faster;
- plan your work through connections, not just lists.
I built this feature for people who think visually and want to see the “big picture” of their projects. It’s simple and intuitive - you can move tasks around, connect them, and explore how everything links together.
Features:
- Added ability to display tasks as graphs - now you can visualize task connections and project structure.
- Save positions of elements in the graph for consistent layouts.
- Create linked tasks by dragging an edge and dropping it in free space.
- Added option to switch between vertical and horizontal graph layouts.
- Added ability to delete connections between tasks.
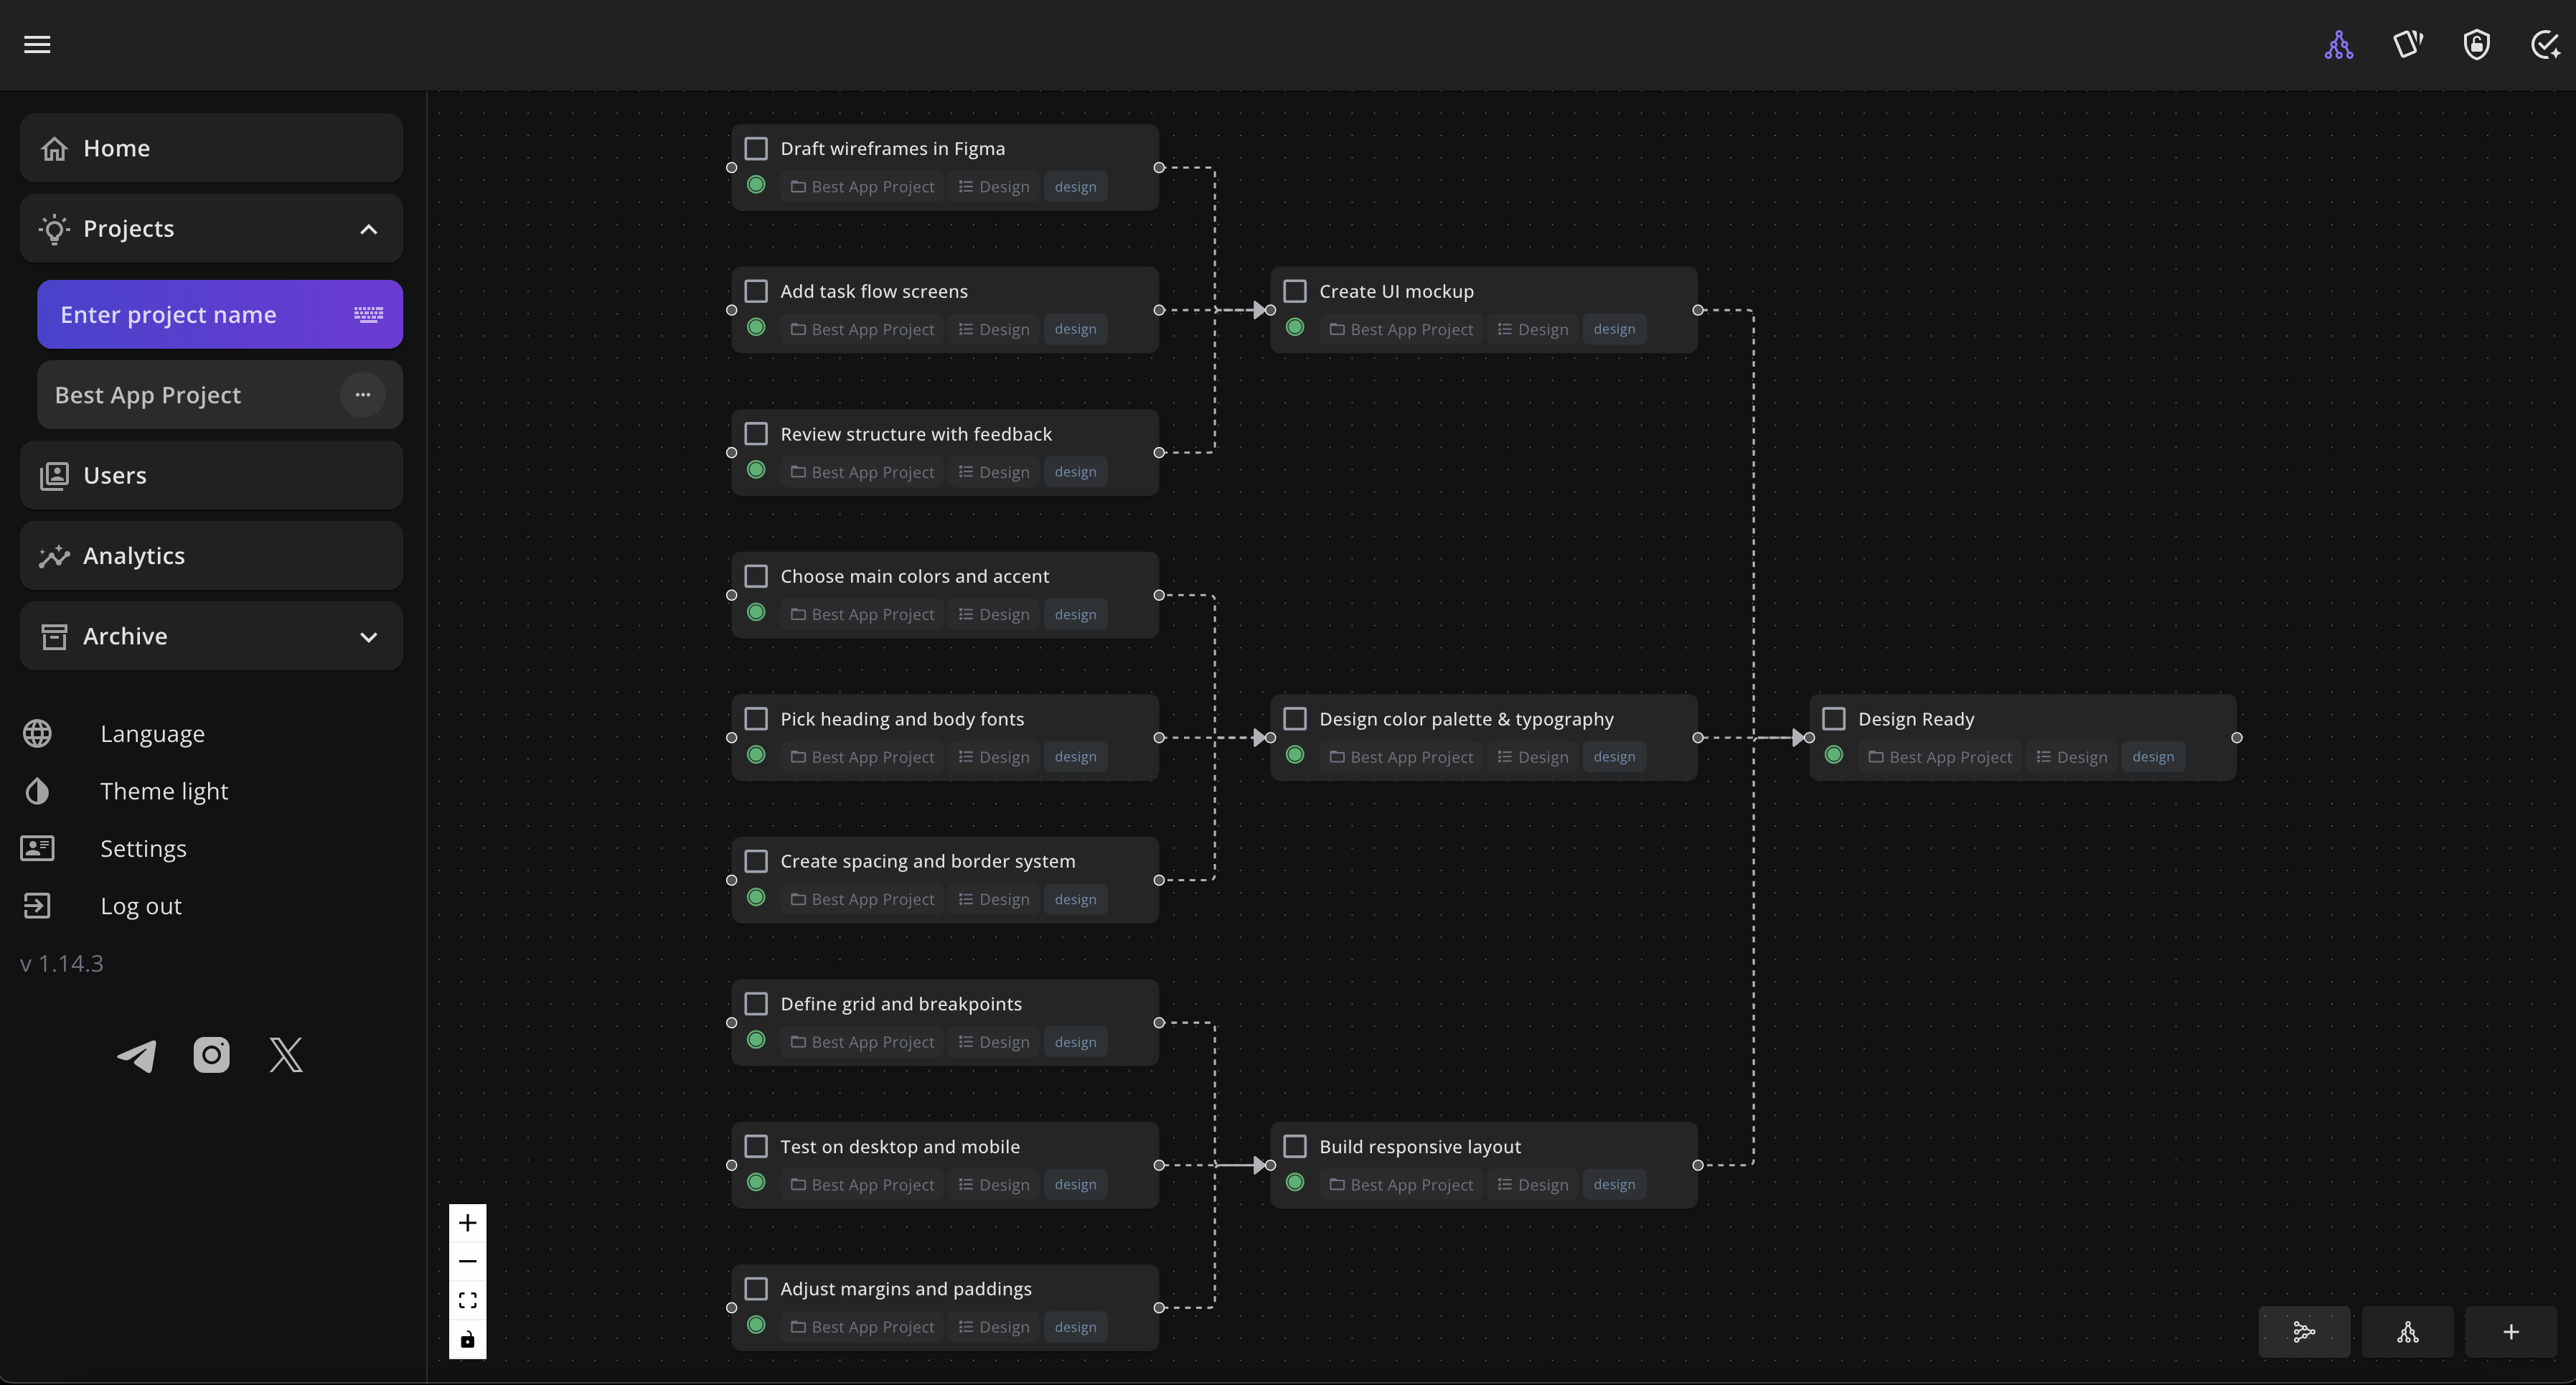
Turn your tasks into graph
TaskView horizontal task graph - visual view of tasks connected by dependencies, showing how projects and subtasks are linked in a clear, organized structure.
TaskView vertical task graph showing project structure with connected tasks and dependencies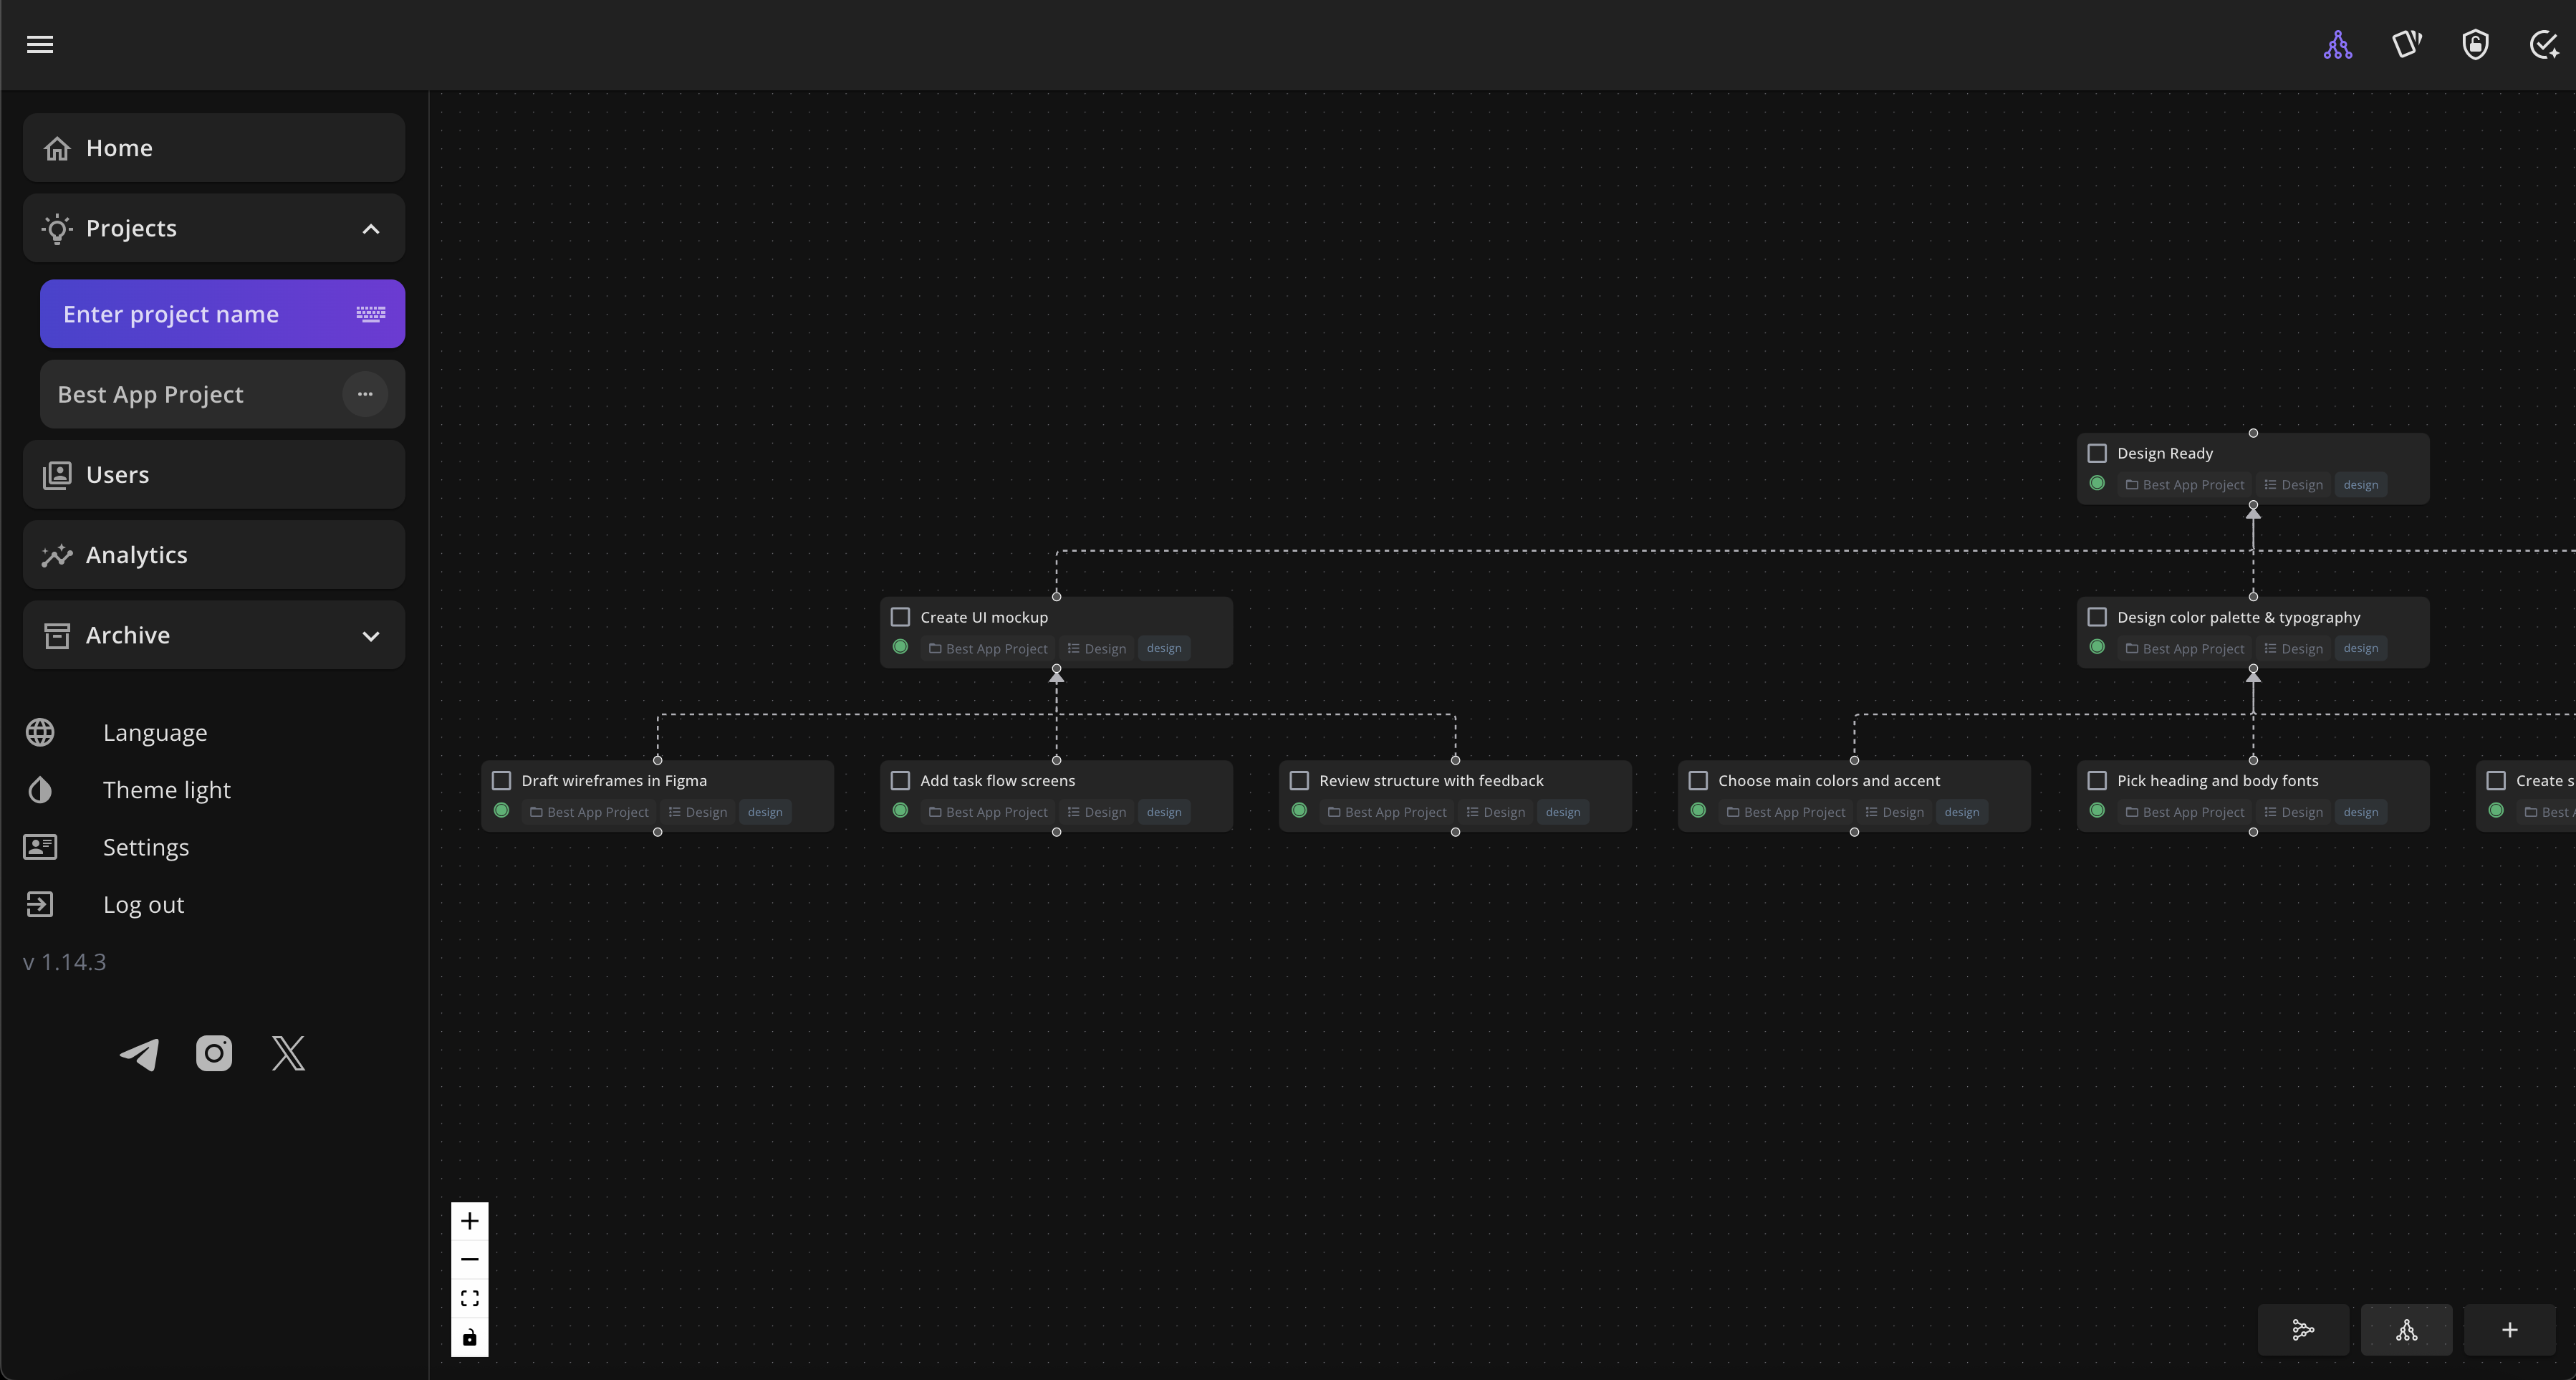
More improvements and settings for the graph are coming soon.
If you want to follow updates or share feedback, you can join:
As always, thanks for supporting TaskView! If you have any questions, feel free to email me at [email protected].
🛠 Fixes
- Fixed an issue with creating a TLS connection for the SMTP client
- Fixed an error during the first user registration